

Report on the 16th iPERC Seminar
- 2023/11/27
On August 30, 2023, “Dr. Warren’s Journal Club” was held at the innovative Photonics Evolution Research Center (iPERC) in Shizuoka University. Journal Club is a lecture where students from Shizuoka University and Hamamatsu University School of Medicine read an English paper and discuss the fusion area of engineering, informatics, and medicine. Dr. Warren visited Hamamatsu campus for the first time in three years, and the journal club was held as a hybrid of the local and online. The journal club focused on the paper (Accurate Post-Calibration Predictions for Noninvasive Glucose Measurements in People Using Confocal Raman Spectroscopy, ACS Sensors, 2023, 8, 1272-1279). The paper demonstrated the practical application of their “noninvasive glucose sensor” for diabetic blood glucose testing.
Diabetes is a chronic disease characterized by abnormally high glucose levels and hemoglobin A1c *1 (* is the terminology number in the glossary) in the blood. It is caused by insufficient or abnormal secretion of insulin, which facilitates the transfer of glucose from the blood to cells in the organ/tissue. According to the WHO Association of Japan, the number of people with diabetes has increased from 108 million (1980) to 422 million (2014) in 34 years, with prevalence rates rising rapidly in low- and middle-income countries. Diabetes is a major cause of blindness, kidney failure, heart attack, stroke, and lower limb amputation, with an estimated 2 million deaths due to diabetes in 2019 [1] ([ ] is the reference number).
There are two types of diabetes: type 1 and type 2. Type 1 diabetes is caused by the destruction of beta cells *2 by autoimmunity. Type 2 diabetes is caused by a lack of insulin action, although insulin is secreted from beta cells. Treatment options for diabetes include diet and exercise therapy, prescription of oral medications for blood glucose control, and insulin therapy. In both types of diabetes, blood glucose monitoring is very important for proper treatment.
The benefits for blood glucose monitoring are as follows:
(1) Patients can measure the correlation between daily life and blood glucose levels in real time,
(2) Prevent the development of acute and chronic complications, and
(3) Reduce the number of hospital visits and hospitalization.
Typical examples of blood glucose monitoring ways are SMBG (self-monitoring of blood glucose), in which glucose is measured directly using blood collected from a fingertip with a needle, and CGM (continuous glucose monitoring), in which a sensor with a tiny needle (filament) is attached to the body and implanted for measurement. Both have their advantages: SMBG provides direct blood glucose monitoring. CGM reduces patient pain by eliminating the need for a needle to draw blood at each measurement. While blood glucose monitoring is beneficial for diabetics, patients face a variety of pain, cost, and appearance issues with the current methods in use. The non-invasive glucose sensor described in this paper is one way to solve these problems.
Non-invasive glucose sensors allow non-invasive blood glucose monitoring by measuring the thenar *3. The advantages of measuring the thenar are as follows:
-The skin is thin and constant,
-High blood volume, and
-Stable measurement is possible due to its restricted movement.
Raman spectroscopy is used as the measurement method. Raman spectroscopy is an analytical method to evaluate substances by irradiating light onto them and using the Raman scattered light generated by the interaction between the light and the materials. When light is irradiated on a material, various phenomena such as absorption, transmission, reflection, and scattering occur. Most of the scattered light is Rayleigh scattering at the same wavelength as the incident light, but a very small amount of light with a different wavelength is included, which is called Raman scattered light. Raman scattered light is classified into Stokes scattered light, which has a longer wavelength than incident light, and anti-Stokes scattered light, which has a shorter wavelength than incident light (Figure 1).
The advantages of using Raman spectroscopy for glucose measurement are as follows:
-Non-invasive measurement,
-Evaluation of biomolecules and solutions (due to low water interference), and
-Low absorption of hemoglobin.
On the other hand, Raman spectroscopy has the disadvantage that the Raman light signal is very weak and difficult to detect.
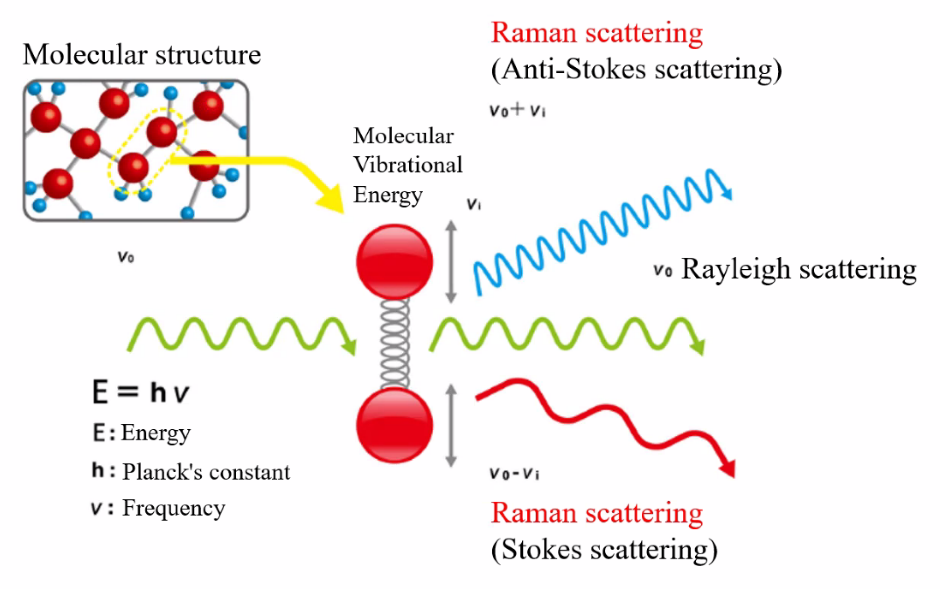
Fig. 1 Raman Spectroscopy [2]
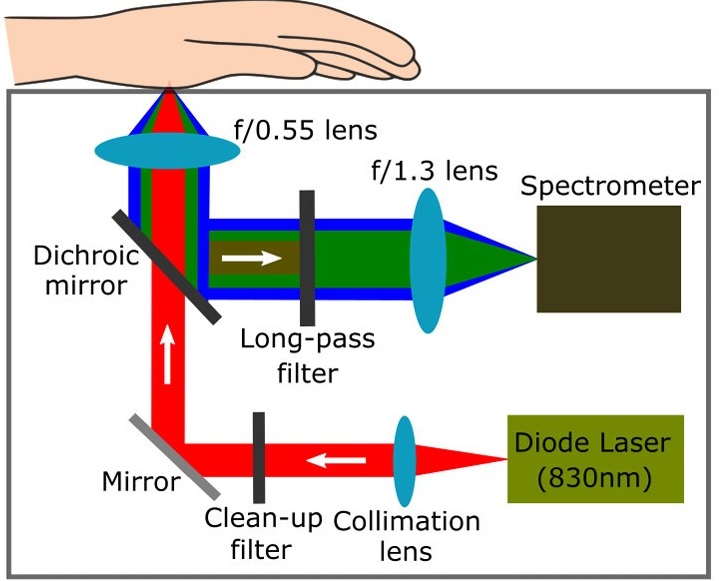
Fig. 2 Noninvasive glucose sensor
Figure 2 shows the noninvasive glucose sensor. The optical hardware is designed as a confocal optical system *4. Light generated by the diode laser *5 (wavelength: 830 nm) is for the aberration *6 to make it parallel light through a collimation lens. The light then passes through a clean-up filter to eliminate natural light that would otherwise be noise, and then passes through a mirror, a Dichroic mirror *7, and an f *8/0.55 lens to irradiate the thenar. The irradiated light interacts with the components between the epidermis and dermis *9 and generates Raman scattered light. After passing through the f/0.55 lens, long-pass filter *10, and f/1.3 lens, the Raman scattered light was measured in the frequency range of 300-1615 cm-1 by a spectrometer with a frequency resolution of about 10 cm-1.
The situation is different from the measurement in systems containing only glucose and requires a measurement model that considers a variety of conditions. One such condition is skin color. To investigate the influence of skin color, spectra were measured for each of the five skin color types classified by the ‘Fitzpatrick scale*11’. The results showed no significant differences in the spectra depending on the skin color.
In addition, the sensor must ensure stability of accuracy over several days to several weeks for practical use. The results of a 15-day post-calibration clinical study confirmed that the average glucose reading was within the reference value of 0.2 mmol/L, and the root mean square error (RMSE) *12 increased only slightly from 1.68 to 1.84 mmol/L over the 15-day period, resulting in an approximately 9.5% decrease in measurement accuracy. The accuracy of the measurement decreased by approximately 9.5%.
A total of 160 patients with type 1 and type 2 diabetes were selected as subjects for the clinical trial. The Consensus Error Grid was used for the evaluation. The Consensus Error Grid is one of the tools used in the clinical evaluation of diabetic patients to assess the results of blood glucose monitoring and ensure patient safety and effective treatment. It is classified into five levels, A-E, as follows:
A: Small error in blood glucose levels and little impact on patient treatment,
B: Error exists, but has only a slight effect on treatment,
C: Error exists and may affect treatment,
D: Errors may adversely affect treatment, and
E: Error is very large and may pose a risk to patient safety.
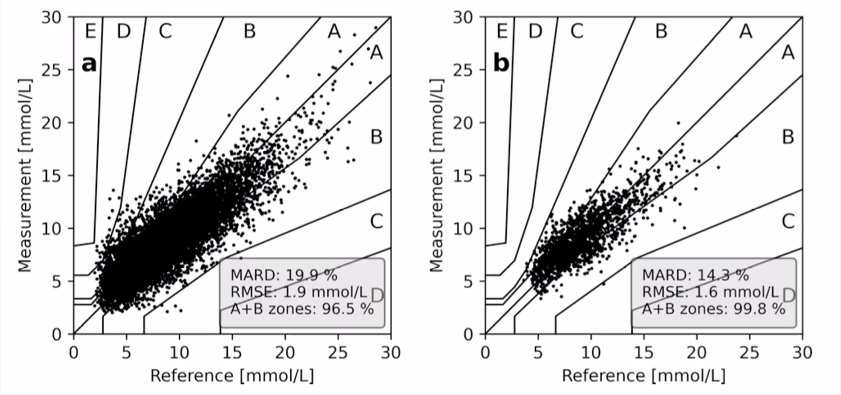
Fig. 3 Measured glucose concentrations plotted as a function of reference values in a consensus error grid for all type 1 (a) and type 2 subjects (b).
Figure 3 shows the measured glucose concentrations plotted as a function of reference values in a consensus error grids for all type 1 (a) and type 2 subjects (b). From the figure, we can see that the MAED *12 is 19.9% and RMSE is 96.5% in patients with type 1 diabetes, while the MAED is 14.3% and RMSE is 99.8% in patients with type 2 diabetes. According to ISO 15197 *13, an RMSE result of at least 99% is required, indicating that the present results for patients with type 1 diabetes are inadequate. RMSE and MAED were found to be strongly affected by a range of glucose concentrations, while age, gender, and skin color did not show significant changes.
Direct evaluation of Raman spectra is very difficult due to external factors such as temperature, uneven skin thickness, and body movements. To solve this, Partial Least Square (PLS) regression *14 was chosen as the calibration model. Pre-processed Raman spectra were used as explanatory variables and glucose values as objective variables.
Typically, cross-validation is used to evaluate PLS models. Cross-validation is a validation method that divides the data and evaluates the performance of a model obtained by analyzing a portion of the data using the remainder of the data. In this case, k-split cross-validation was used.
First, the training data is divided into k parts (k = 20 in this case), one of which is the test data, and the rest is the training data. After building the model with the training data, the prediction performance is estimated with the test data. Repeat this with all parts. These models are averaged together to produce the final prediction model. Results show that the PLS algorithm gives consistent results despite the significant spectral variability of the patients. Therefore, the combination of Raman spectroscopy and PLS regression clearly demonstrated that a practical evaluation is possible.
In the currently used enzyme electrode method *15, glucose values are obtained from a linear relationship between measured current and glucose concentration. This method has the problem of being susceptible to disturbances. Statistical methods, on the other hand, can determine glucose values from many variables, including disturbances. While electrochemical methods are sufficiently accurate, statistical methods have a significant advantage in that they are noninvasive. For statistical methods to become more common in the future, more data collection and more general and robust statistical models will be needed.
By combining Raman spectroscopy and PLS regression, the authors have successfully developed a non-invasive glucose monitoring device that diabetics can use at home. The device proved to be an appropriate assessment regardless of age, gender, or skin color. Most importantly, sufficient measurement accuracy is ensured within 15 days after calibration. On the other hand, various issues remain, such as further miniaturization of the device, improvement of accuracy, and reduction of calibration procedures. While solving these issues, new diabetes management methods will expand in the future.
Q&A
Q1: “How long does one measurement take? “
A1: “It is estimated that about one to five minutes are needed for each measurement. In this case, since the measurement site is the hand, sufficient stability is obtained, and only short measurement time is required. However, if the measurement site was on the head or feet, more measurement time would be required because the subject would be moving.”
Q2: “The optical component diagram (Fig.2) does not have the pinholes required for confocal optics. Where is the pinhole located?”
A2: “It is probably placed in front of the spectrograph.”
(In the paper, it is described that the lens on the incident slit of the spectrograph also functions as a pinhole. (Comment by the author of this report))
Q3: “Doesn’t the pressure change the blood pressure and affect the measurement since the skin is pressed down during measurement?”
A3: “According to previous studies, the effect is thought to be small.”
Q4: “What range of blood glucose levels is effective up to?”
A4: “For hypoglycemia (0-3.9 mmol/L) the MARD was 58.8% and for hyperglycemia (10.1-30.0 mmol/L) the MARD was 13.9%. Thus, the error is likely to be large and cannot be properly assessed in the hypoglycemic glucose concentration range.”
Q5: “Is the statistical method less error prone than the enzyme electrode method?”
A5: “The method of measuring blood (enzyme electrode method) is considered the most reliable. A single drop of blood is sufficient for the measurement. However, blood in the body is never constant. Therefore, it is difficult to determine that the chemical method is absolutely correct.”
Q6: “The Raman spectra should include spectra other than glucose, but can the fingerprint spectrum of glucose be confirmed so accurately?”
A6: “The result strongly depends on the regression model. Previous studies have tried other regression models, but this regression model showed very good results. On the other hand, there are many unknowns with such statistical methods, and it is difficult to prove that they are reliable. The use of large-scale medical data to elucidate the mechanisms of new treatments and diseases and to develop effective medical strategies, is known as the ‘Holy Grail of Medicine,’ and is the most difficult and important goal or task to be achieved in the medical field.”
Q7: “I think this device is accurate enough for daily use, but is it accurate enough for medical use?”
A7: “ISO 15197 is only an evaluation standard for glucose monitoring and is a minimum evaluation standard. Therefore, it is sufficiently accurate for daily monitoring, but it is assumed that more accurate accuracy will be required in the medical field.
Comment
I think the potential of this device is immeasurable because it can propose a new testing method for diabetics, who are increasing worldwide, and contribute to preventive medicine and personalized medicine. The “patient’s perspective,” which Hamamatsu University Medical School students emphasized, was a special perspective that could be found in the medical engineering program. In recent years, there has been active development of innovative pharmaceutical devices, and it is expected that by linking them with non-invasive diagnostic devices such as the one proposed in this paper, medical care can be provided without burdening the patient. Therefore, forums like the Journal Club for discussions on the fusion of engineering, informatics, and medicine will become more and more indispensable.
Presenters
Mr. Yuto Moriya (3rd year), Faculty of Medicine, Hamamatsu University School of Medicine
Mx. Ayaka Shimizu (4th year), Faculty of Medicine, Hamamatsu University School of Medicine Mr. Ryo Tabata (2nd year, doctor course), Graduate School of Science and Technology, Shizuoka University
Mr. Kosuke Ono (2nd year, doctor course), Graduate School of Science and Technology, Shizuoka University
Glossary
*1: Hemoglobin A1c
Hemoglobin is a type of protein found in red blood cells that is responsible for delivering oxygen to cells throughout the body. When glucose in the blood binds to hemoglobin, it becomes glycated hemoglobin. The higher the blood glucose level, the greater the amount of glucose bound to hemoglobin. Once glycated, hemoglobin does not return to normal until the end of the red blood cell’s life span (120 days).
Hemoglobin A1c is the percentage (%) of total hemoglobin that is glycated hemoglobin. Hemoglobin A1c reflects blood glucose levels from the past month or two, so it is not affected by short-term blood glucose levels such as the day’s diet or exercise. As a guide for judgment, a hemoglobin A1c level of less than 5.6% is considered normal, and a hemoglobin A1c level of 6.5% or higher is considered diabetic. Since diabetes is judged comprehensively based on the presence or absence of symptoms, blood glucose level, and hemoglobin A1c level, hemoglobin A1c is considered only one of the criteria for diagnosis [3].
*2: Beta Cells
A cell that produces insulin in the isles of Langerhans in the pancreas.
*3: Thenar
The fleshy area of the palm at the base of the thumb.
*4: Confocal optical system
In this optical system, light passes through a lens and is focused on the sample. The reflected light again passes through the lens and is focused on the detector. Since both the sample and the detector are in focus, this is called confocal.
Light generated out of focus is focused in front of and behind the pinhole, so most of the light is blocked and does not reach the detector. Thus, by using a pinhole, only light emitted from the sample can be directed to the detector.
*5: Diode Laser
Its features are as follows:
-Compact size,
-Easy to oscillate,
-High conversion efficiency, and
-Various wavelength lasers can be created.
*6: Aberration
An optical phenomenon in which light rays do not converge correctly on a single point, resulting in an imperfect image.
*7: Dichroic mirror
It transmits light in a specific wavelength region and reflect light in another wavelength region. In the academic paper, it is thought that the dichroic mirror is used to transmit the irradiated laser light and reflect the Raman scattered light.
*8: f
It indicates the focal length.
*9: Epidermis and dermis
The skin is composed of three layers: epidermis, dermis, and subcutaneous tissue. The epidermis has no nerves and blood vessels. The dermis is several to several dozen times thicker than the epidermis and contains blood vessels, nerves, and lymphatic vessels.
*10: Long-pass filter
It is the filter that cuts off light shorter than a specific wavelength and transmit light longer than a specific wavelength.
*11: Fitzpatrick scale
This is a scale that classifies human skin color into six levels based on sensitivity to UV (Ultraviolet) exposure.
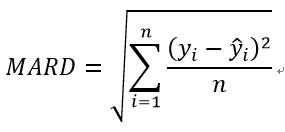
*12: RMSE and MARD
RMSE (Root Mean Squared Error) is calculated by:
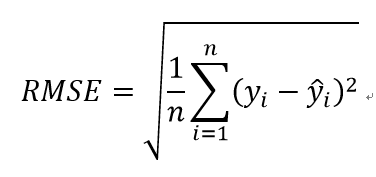
where is n the number of data, yi is the observed value, and ![]() is the predicted value.
is the predicted value.
MARD (Mean Absolute Relative Difference) is calculated by:
*13: ISO 15197
ISO (the International Organization for Standardization) is an independent, non-governmental international organization with a membership of 169 national standards bodies. ISO 15197, “in vitro diagnostic test systems – requirements for blood glucose monitoring systems for self-testing in managing diabetes mellitus,” is a standard for blood glucose self-measurement. It was issued in 2003 in recognition of the importance of blood glucose self-measurement as a special medical device used directly by patients and the need for certain standards to correctly measure blood glucose levels as an indicator of treatment. However, it was revised in 2013 in response to demands from the clinical field for stricter requirements, such as requests for further performance improvement of the SMBG system at a public hearing on blood glucose monitoring sponsored by the FDA (U.S. Food and Drug Administration). With this revision, evaluation by consensus error grids was added [5].
*14: PLS regression
Regression analysis is one statistical technique that reveals the relationships among multiple data. To predict the objective variable, the influence of the explanatory variables is quantified, and their respective relationships are modeled.
The simplest regression analysis is a single regression analysis: we can predict the objective variable Y by finding A, B in a linear model where Y=AX+B. In this case, the explanatory variable X has only one component, but when there are two or more components, it is called multiple regression analysis.
However, in multiple regression analysis, there is the multicollinearity. It is the case in which there is a strong association between explanatory variables. In the case of multicollinearity, the accuracy of the regression may be extremely poor, and the regression coefficients may show abnormal values.
PLS regression is one analytical method that avoids this multicollinearity. In PLS regression, latent variables are used. First, a weight component is determined such that the covariance between the explanatory variable X and the objective variable Y is maximized. Next, the weight components are used to determine the latent variable. For the explanatory variable X1 and the objective variable Y1, which are the residual data after removing the data that can be explained by this latent variable, the latent variables are again determined so that the covariance between X1 and Y1 is maximized. This is repeated until sufficient accuracy is obtained [6].
*15: Enzyme electrode method
Applies a potential to an electrode connected to the substance. The substance is oxidized or reduced, generating electrons. The amount of enzyme is estimated by measuring the current, which is the flow of electrons. Typically, the glucose oxidase electrode method is used in SMBG [7].
References
[1] 糖尿病, 公益社団法人日本WHO協会, Updated: 2023/4/5
https://japan-who.or.jp/factsheets/factsheets_type/diabetes/
[2] ラマン分光の原理, 株式会社堀場製作所, Accessed: 2023/10/11
https://www.horiba.com/jpn/scientific/technologies/raman-imaging-and-spectroscopy/raman-spectroscopy/
[3] HbA1c(ヘモグロビンエーワンシー)ってなに?, 国立研究開発法人国立循環器病研究センター, Undated: 2021/10/21
https://www.ncvc.go.jp/hospital/section/ld/endocrinology/hba1c/
[4] 半導体レーザー(半導体レーザー), ウシオ電機株式会社, Accessed: 2023/10/11
https://www.ushio.co.jp/jp/technology/glossary/glossary_ha/ha_laser_diode.html
[5] ISO15197:2013について, アークレイ株式会社, Accessed: 2023/10/11
https://www.arkray.co.jp/japanese/science/monoshiri/pdf/monoshiri_01.pdf
[6] 高島有哉, 森林遺伝育種のデータ解析方法(実践編10) 主成分回帰(PCR)と部分最小二乗回帰, 森林遺伝育種第12巻, 2023
[7] 血液から見える健康―第13回 血糖―糖尿病の検査, インクロム株式会社, Accessed: 2023/10/11
https://www.medimag.jp/about.html
innovative Photonics Evolution Research Center (iPERC)
3-5-1 Johoku, Chuo-ku, Hamamatsu, Shizuoka 432-8011 Japan
phone: +81-53-478-3271 / fax: +81-53-478-3256